Reporting overview
Insights reports provide a deeper look into trends and performance across ProsperStack, including retention, offers, deflections and customer feedback.
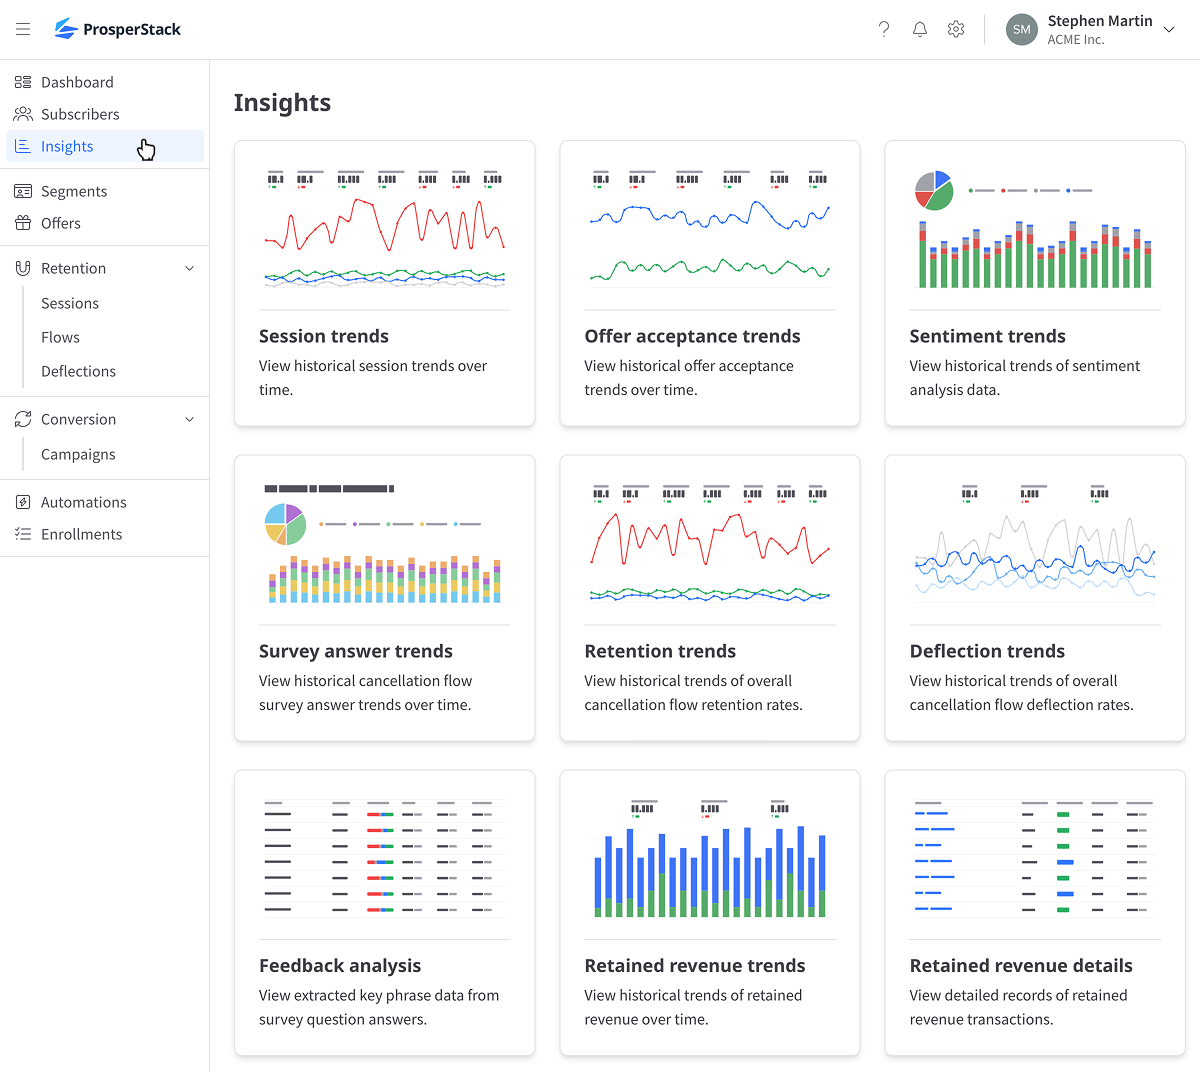
Reports
- Session trends
- Offer acceptance trends
- Sentiment trends
- Survey answer trends
- Retention trends
- Deflection trends
- Feedback analysis
- Retained revenue trends
Filtering
By date range
All Insights reports can be filtered to data within a specific date range.
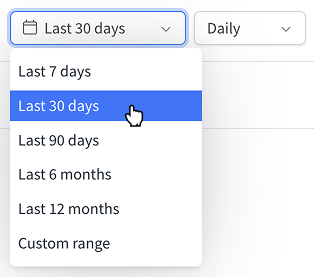
For bar and line charts, you may choose between daily, weekly and monthly aggregation.
By flows and segments
Flow and segment filters allow you to filter reports to data related to specific flows and/or segments.
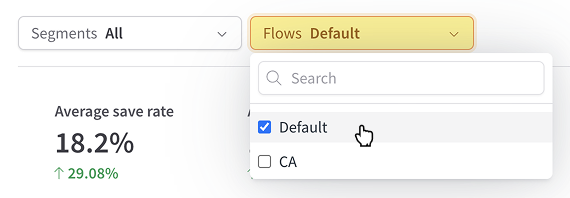
Note that these filters only appear if you have multiple flows and/or segments.
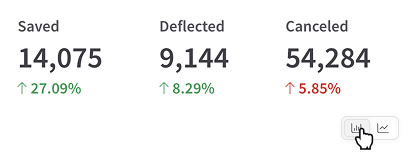
Summaries and trends
A summary of report data is provided above trend charts.
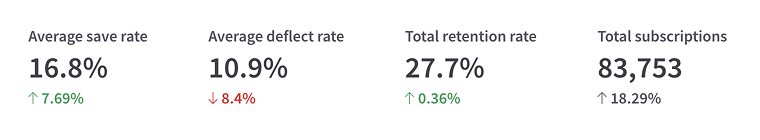
Trend indicators show changes in retention performance compared to the previous period.
Chart annotations
Whenever changes are published to a flow you can optionally include a note that will appear on reports. This makes it easier to keep track of changes and compare results before and after.
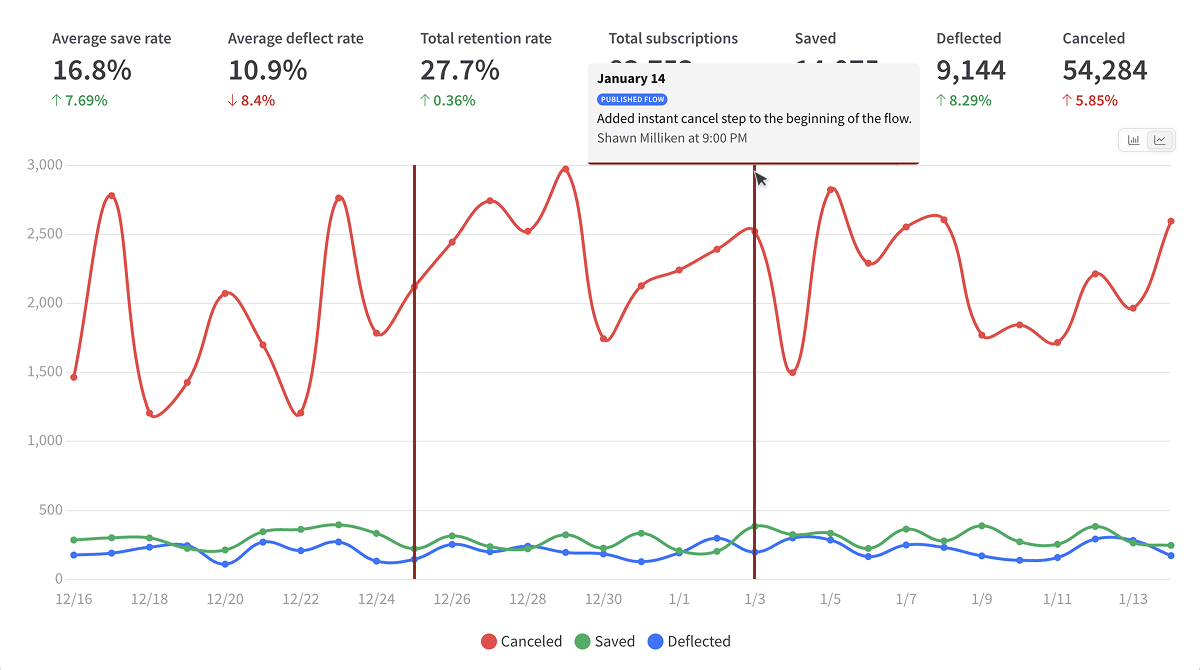
Viewing bar or line charts
Toggle between bar and line charts by clicking the icon near the top right corner of the chart.
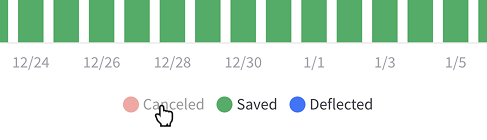
Hide data series
Toggle data series visibility by clicking the description in the legend beneath the chart.